Research
The majority of research performed within the group focuses on ice sheets and how they interact with the solid (rocky) Earth and influence sea-level change. We develop and apply computer models that simulate interactions between ice sheets, ocean levels and the solid Earth to learn about these components of the Earth System. Through modelling various types of observations, we aim to better understand how ice sheets respond to climate change, the influence of climate change on sea level, and the physical properties of the Earth’s interior. By considering both ancient (geological) and contemporary (geodetic) data, our research covers a broad range of timescales and advances our understanding of past and future climate and sea-level change.
Some examples of past projects are given below to illustrate the range and type of research we do. You can find many other examples by looking at our publication list.
Understanding the past evolution of the Greenland ice sheet
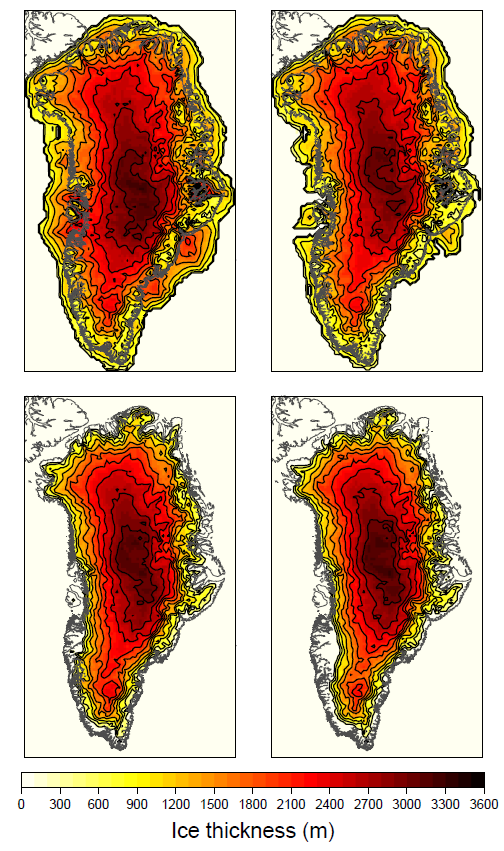
The focus of this work has been to better understand how the ice sheet has responded to climate change since the last glacial maximum (around 20,000 years ago). The image on the right from Lecavalier et al. (2014) (link below) shows estimates of ice thickness at four past times since the last glacial maximum: 16,000 yr ago (top left), 12,000 yr (top right), 8,000 yr (bottom left), 4,000 yr (bottom right). The ice sheet was much larger during (and shortly after) the last glacial maximum and decreased in size due to natural climate change, reaching a minimum volume around 4,000 years ago. The ice sheet grew since then to reach an extent close to that observed through most of the 20th century. The ice sheet was close to zero mass balance during the latter half of the 20th century but has been losing mass since around the beginning of the 21st century due to anthropogenic climate change. Our work aims to provide a longer-term context for changes observed in the past few decades, as well as to test models used to simulate the ice sheet and, ultimately, better understand the processes that govern its evolution on different timescales.
Constraining properties and structure of the deep Earth
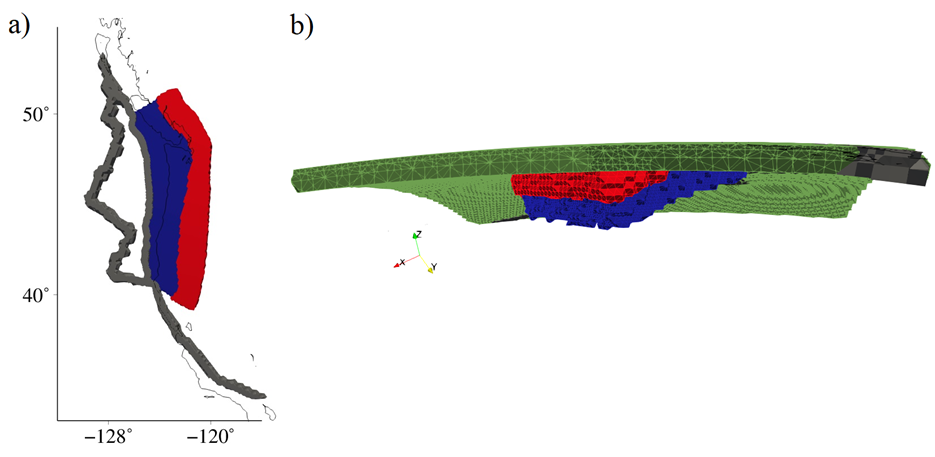
During the past few million years, the Earth has transitioned between cold (glacial) and warm (interglacial) periods. These transitions are characterised by large changes in land ice volume and sea level. For example, during the most recent glacial-interglacial transition (approximately 20,000 to 7,000 years before present), large ice sheets over North America and Eurasia completely melted. This continental ‘unloading’ process driven by climate change is a wonderful natural experiment for learning about the rheology and structure of the deep Earth. We take advantage of this Earth forcing by modeling observations in previously (and currently) glaciated regions. The image on the left is from Yousefi et al. (2021) (link below), where we tested Earth models with 3-D structure along the Pacific coast of southern Canada and northern USA. Frame (a) shows a plan view of the study region with plate boundary (thick grey line), and includes the Cascadia subduction zone (slab shown in blue, and postulated low viscosity ‘mantle wedge’ above the slab shown in red). Frame (b) shows a the same structure as in (a) but looking south. The green layer represents non-subducted lithosphere.
Interpreting observations of vertical land motion
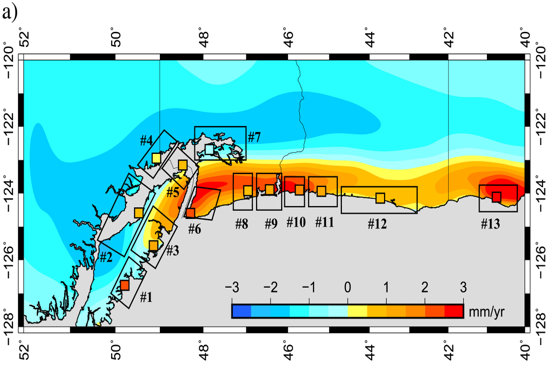
The land surface moves due to different processes (e.g., body tides, isostasy, tectonics) that operate on a broad range of timescales. Measurements of this motion provide constraints on these underlying processes. By considering observations that span different timescales (millennia to decades) it is possible to separate the relative contributions of different processes. This is particularly important in regions at risk due to natural hazards, as illustrated in the examples highlighted below associated with coastal flooding along the US Gulf coast (Kuchar et al., 2018) and earthquake hazard associated with the Cascadia subduction zone (Yousefi et al., 2020; see also a spotlight on this paper by the American Geophysical Union). The image on the right is from Yousefi et al. (2020) and shows modelled vertical land motion due to interseismic deformation (background colour) compared to observations where the contribution from isostatic processes has been removed (coloured squares). Note that the map has been rotated 90 degrees anti-clockwise (‘left’ is North).
Understanding and projecting sea-level change
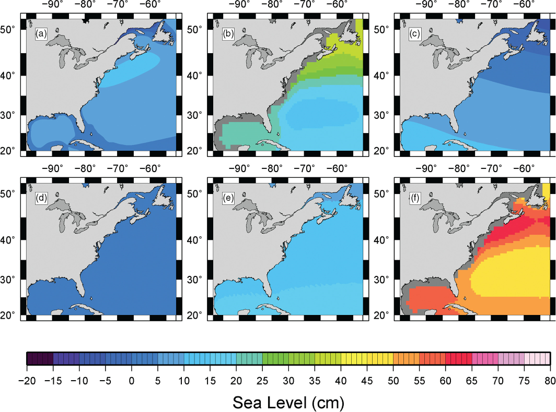
Sea-level rise is one of the greatest hazards associated with global warming. The rate of this rise will vary from region to region due to the spatial patterns inherent to the dominant processes. Predicting sea-level change in any given region is difficult because of this spatial variability which reflects these underlying processes (climate and non-climate related). Of key importance is the identification of areas that are at the greatest risk to rising sea levels. It is important to identify the processes driving sea-level change in a given region in order tp accurately assess the associated hazard. The image on the left is from Love et al. (2016) (link below) and shows the contributions of different processes to 21st century sea-level rise in the region shown: (a) glacial isostatic adjustment, (b) ocean steric/dynamics, (c) Greenland ice melt, (d) Antarctic ice melt, (e) melting of glaciers and ice caps, (e) sum of a-e.
Developing models of sea-level change
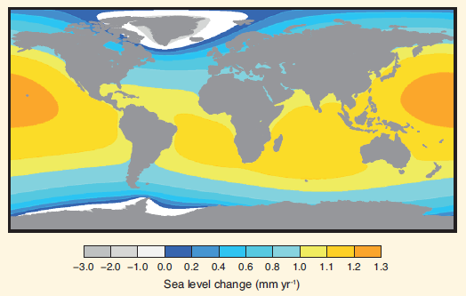
Due to the large number of processes that contribute to sea level change, there is currently no single model that simulates all of them. Therefore, understanding past and predicting future changes generally requires considering output from a suite of different types of model. Our group and collaborators specialise in developing and applying models that simulate sea-level changes caused by changes in land ice (ice sheets and glaciers). The melting of land ice was a dominant contributor to sea-level change during the glacial cycles of the late Quaternary and it will be a major contributor to future sea level rise as land ice responds to climate warming. Thus, there is a clear need to continue to develop and improve this type of sea-level model. The image on the right shows modelled sea-level change due to melting from the Greenland and Antarctic ice sheets at a rate of 0.5 mm/yr each (global mean sea-level equivalent). The modelled sea-level rise is reduced near the ice sheets but amplified in equatorial regions due to the underlying physical processes. This figure is from Chapter 13 of the Intergovernmental Panel on Climate Change (Assessment Report 5).