Problems and Solutions 1. The following data were collected during a storm event on a river in central Kentucky in the summer of 1995:  
Day
SiO
d18O
Qt (m3/s)
0.1
4.30
-4.7
3
0.5
4.95
-4.4
10
1
5.63
-4.2
22
2
6.60
-4.3
15
3
7.83
-4.7
8
5
9.11
-5.1
4
10
11.2
-5.8
2
groundwater
12
-6.0
rain
0.1
-2.0
soil water
3.5
-4.8
  Perform a hydrograph separation with these data using the single parameter method (d18O) to determine the proportion of groundwater and runoff in discharge for each day. Now, using the two component method with d18O and Si, determine the percentage of groundwater, soil water and runoff in discharge. Compare the results for the peak discharge (t = 1 day). What is the discrepancy in estimation of the groundwater component of discharge between the two methods?  

Using the single component separation (d 18O), according to the formulation given earlier in this chapter, the separated hydrograph is:
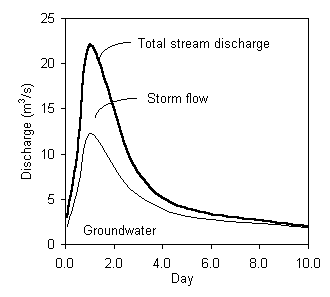
 
Day
Qt
Qgw
% gw 
discharge
0.1
3
2.0
67.5
0.5
10
6.0
60.0
1
22
12.3
56.0
2
15
8.6
57.0
3
8
5.4
67.5
5
4
3.1
77.5
10
2
1.9
95.0
  From this separation, groundwater dominates discharge at the peak, where it makes up 56%.

Now using both Si and d18O, the hydrograph can be separated into three discharge components. These are shown in this graph:
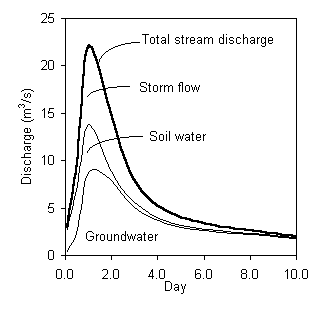
 
day
Qt
Qgw
Qr
Qs 
% gw discharge
0.1
3
0.4
0.3
2.3
13.1
0.5
10
2.7
2.6
4.6
27.5
1
22
8.8
8.2
5.1
39.9
2
15
7.9
6.2
0.9
53.0
3
8
5.1
2.5
0.5
63.2
5
4
3.0
0.8
0.2
74.5
10
2
1.8
0.1
0.1
92.1
  In this separation, the groundwater component makes up only 39.9% of the peak discharge after 1 day, and soil water (unsaturated zone groundwater) makes up 23.2%. Together, these components make up 63.1% of the peak discharge, which is close to the 56% determined using the single component method.
 
 
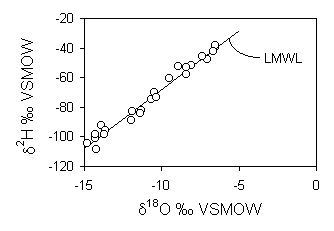
2. The following data (or download as an Excel 3.0 or Excel 5.0) were measured for groundwater in a sand aquifer beneath an agricultural field in a region that receives 460 mm of precipitation annually. Precipitation has an average of 8 mg/L Cl. The enrichment of Cl in the groundwaters indicates some loss of recharge water during infiltration. Is this due to evaporation or transpiration from the soil by crops? Calculate the fraction of water lost, and the annual recharge rate (mm/yr). The local meteoric water line is d2H = 8.0 d18O +12 ‰. Comment on the seasonality of any water loss.
 
d 18
d 2
Cl
d 18
d 2
Cl
–13.9
–92
11
–13.7
–95
8
–6.6
–40
45
–10.7
–74
42
–14.2
–108
11
–14.3
–99
9
–9.5
–61
45
–13.7
–99
7
–7.1
–48
46
–6.6
–38
53
–7.4
–46
52
–6.7
–42
52
–8.1
–52
44
–10.3
–74
41
–8.4
–58
48
–11.3
–82
22
–8.4
–53
44
–14.8
–105
8
–8.9
–52
38
–11.9
–83
26
–14.3
–101
12
–12.0
–89
22
–10.5
–70
41
–11.4
–85
30
  A plot of d18O and d2H shows that these waters are not evaporated, and so water loss must be due to transpiration, which is non-fractionating.

The Cl content in recharge water is 8 mg/L. The fraction recharge R is determined from the relationship:
 

Clgw = Clo/R For these groundwaters, the average fraction recharge R = 0.406 (varying between 0.151 and 1), and so the average water loss is 59.4%. If we assume that there is no runoff from this landscape, then this translates into an annual recharge rate of 0.406 ´ 460 mm = 187 mm of precipitation. However, surface water discharges from the basin would have to be gauged in order to fully balance the groundwater budget.

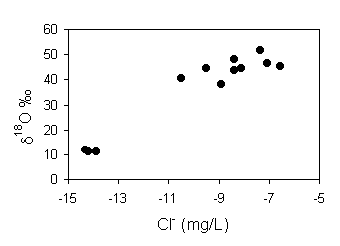
The seasonality of transpiration water loss is evident from a plot of d18O vs. Cl. There is a reasonably good correlation between these parameters, showing that the greatest enrichments in Cl occur when precipitation is the most isotopically enriched, i.e. during the summer months when transpiration by crops and other vegetation is at a maximum and recharge at a minimum.
3. Plot the following data (Excel 3.0 or Excel 5.0 file) for the stable isotope composition of groundwaters sampled from deep bedrock (BR) and shallow alluvial (AL) aquifers in a region with mean annual air temperature of 28°C and humidity of 40%.
 
Well ID
Cl 
(mg/L)
d18
d2
Well ID
Cl 
(mg/L)
d18
d2
Well ID
Cl 
(mg/L)
d18
d2
AL12
770
–0.36 
3.0 
AL38
12470
0.44 
3.5 
BR5
484
–2.64 
–5.3 
AL13
495
0.01 
4.6 
AL39
574
–0.01 
5.8 
BR6
835
–3.28 
–14.1 
AL14
538
0.10 
5.2 
AL40
363
–7.60 
2.6 
BR7
1607
–3.18 
–13.5 
AL15
460
–0.31 
5.1 
AL41
363
–0.69 
2.4 
BR8
417
–3.14 
–8.0 
AL16
2450
–0.76 
0.2 
AL42
9620
0.07 
1.9 
BR9
468
–3.26 
–11.7 
AL17
11150
0.46 
3.7 
AL43
930
–1.66 
–4.3 
BR10
1365
–3.67 
–16.6 
AL18
4170
–0.55 
1.2 
AL44
406
–1.66 
–8.0 
BR11
546
–2.68 
–8.1 
AL19
335
–0.44 
4.4 
AL45
406
–1.42 
–9.0 
BR12
339
–1.91 
–3.4 
AL20
335
–0.40 
4.0 
AL46
380
–1.30 
–4.5 
BR13
252
–2.89 
–7.1 
AL21
6130
–0.20 
2.8 
AL47
380
–1.19 
–4.1 
BR14
259
–2.39 
–5.8 
AL22
337
–0.51 
1.2 
AL48
382
–1.00 
–1.0 
BR15
343
–2.42 
–4.8 
AL23
337
–0.46 
1.1 
AL49
382
–0.91 
–0.9 
BR16
304
–2.32 
–2.7 
AL24
404
–0.59 
1.5 
AL50
528
–1.45 
–6.0 
BR17
555
–3.80 
–14.3 
AL25
404
–0.54 
1.4 
AL51
644
–1.29 
–4.1 
BR18
343
–2.70 
–7.6 
AL26
577
–0.07 
3.5 
AL52
3620
–0.68 
0.1 
BR19
555
–2.22 
–4.7 
AL27
18540
1.01 
5.1 
AL53
14760
0.84 
4.1 
BR20
468
–3.41 
–10.6 
AL28
7840
–0.06 
2.6 
AL54
740
–0.70 
–0.5 
BR21
410
–3.45 
–11.7 
AL29
437
–0.68 
0.8 
AL55
620
–0.95 
–3.3 
BR22
1170
–3.36 
–11.4 
AL30
14050
0.70 
4.4 
AL56
11660
0.26 
4.4 
BR23
794
–2.62 
–8.1 
AL31
554
–0.11 
3.0 
AL57
5480
–0.26 
1.3 
BR24
302
–2.73 
–5.7 
AL32
374
–1.10 
0.6 
AL58
19680
1.26 
6.1 
BR25
306
–3.44 
–14.0 
AL33
374
–1.00 
0.5 
BR26
357
–3.76 
–16.2 
AL34
9000
0.17 
3.4 
BR1
257
–3.66 
–12.4 
BR27
264
–3.52 
–14.7 
AL35
4950
–0.68 
2.2 
BR2
293
–2.89 
–9.5 
BR28
293
–3.04 
–11.6 
AL36
650
–1.27 
–2.8 
BR3
295
–2.13 
–4.3 
BR29
519
–2.90 
–12.7 
AL37
523
–0.77 
3.2 
BR4
278
–3.09 
–9.7 
BR30
335
–2.26 
–5.7 
  Compare these data with the local meteoric water line (d2H = 7.6 d18O + 14‰). and comment on the relative degree of evaporation that occurred during recharge for alluvial and bedrock groundwaters. What can you say about the isotopic composition of the recharge waters to both aquifers?
 
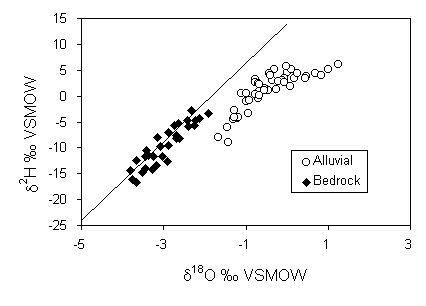
  The recharge waters to the bedrock aquifer fall on the local meteoric water line, and so have experienced marginal mixing during recharge. By contrast, the alluvial aquifer groundwaters are relatively enriched in both isotopes, with a preferential 18O-enrichment signifying evaporation.
 
 
Many of the alluvial aquifer groundwaters are situated in a coastal zone of heavy exploitation, and intrusion of seawater into this coastal aquifer is suspected. Using a combination of d18O, d2H and Cl data, determine whether the observed chloride enrichments could be produced by evaporation, or by saline intrusion. In the case of seawater intrusion, determine the percent mixing with seawater (d18O = 1‰, d2H = 5‰ and Cl = 19500 mg/L).
  If a plot of d18O or d2H vs. Cl is made, it becomes very clear that there is a correlation for the high Cl samples. From this figure, one can say that it is the samples with Cl > 1000 mg/L that show a mixing relationship with seawater. For the low Cl samples, the average d18O value is –0.83‰, and the average Cl value is
 
It is not possible that these waters have been evaporatively enriched in both Cl and 18O, as this would not follow a trend like this. The theoretical enrichment of the alluvial groundwaters can be modelled using the humidity and temperature conditions given above. For d18O, the kinetic enrichment De18O associated with evaporation is:
  De18O = 14.2 (1– h) ‰,

= 14.2 (1 – 0.4) = 8.52

and the total enrichment during evaporation is then the sum of the kinetic enrichment factor and equilibrium enrichment factor (at 28°C, Table 1-5):
  ew–v = De + eequil

= 8.52 + 9.1 = 17.6‰

Using a Rayleigh equation we can determine the d18O value of the water after an evaporative enrichment that would concentrate Cl from an average of 484 mg/L (for the low salinity samples with Cl < 1000 mg/L) to that of seawater (19,500 mg/L) which would require evaporation to a residual fraction of:
  f = 484/19,500 = 0.025 From the Rayleigh formulation (note that e has been reversed to represent the vapour-water [product-reactant] enrichment) we get:
  d18Ofinal = d18Oinitial + ev–w · lnf

= –0.83 – 17.6 · ln (0.023)

= 64.1‰
 

As this is far greater than the measured values, we cannot produce these Cl concentrations by evaporation.

The percent mixing would be determined using either Cl or d18O, from the ratio:
 

e.g. AL42 = 100 ´ (9620 – 484)/(19,500 – 484) = 48%
Results for the remainder of the samples range from 10% seawater to just over 100% seawater.
 
 
For the alluvial groundwaters that are unaffected by seawater intrusion, use a Rayleigh model and the T–h conditions given above to determine an average evaporative loss during recharge. Assuming the same T–h conditions, what percentage of precipitation was loss to evaporation during recharge of the bedrock groundwaters?
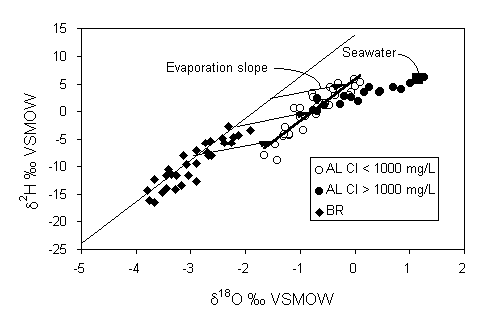
  The seawater mixing trend can also be observed on the d18O – d2H diagram, which distinguishes these alluvial groundwaters from those that are unaffected by seawater mixing:

This evaporative loss can be calculated using the same Rayleigh formulation given above. However, in this calculation, the final d18O is the mean of the low salinity samples, and the initial d18O value is found by extrapolating horizontally (constant d2H) to the LMWL. This can also be calculated by using the corresponding d2H value for the average of these data (0.03‰) in the equation for the LMWL:
 

0.03 = 7.76 d18O + 14

d18O = –1.8‰
 

And so:
  d18Ofinal = d18Oinitial + ev–w · lnf

–0.83 = –1.8 – 17.6 · ln f

f = 0.95
 

This calculation then indicates that for the T-h conditions stated at the outset, these groundwaters have experienced on average only 5% water loss due to evaporation during recharge.
 
 
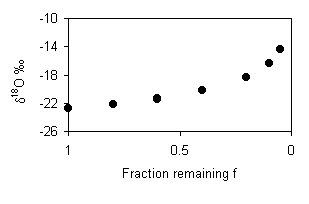
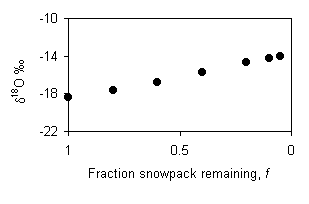
4. Sketch a schematic graph of d18O in runoff vs. time for the meltwater from a winter snowpack during spring melt. Assume a mean value of –20‰ for the snow prior to any melting. Revise your sketch for the condition that melting was largely due to spring rains, with d18O = –14‰.


The isotopic evolution of the snow pack will increase during melting as the infiltrating meltwater continues to re-equilibrate with the residual snow. As there is a depletion in the water, the residual snow becomes progressively enriched according to a Rayleigh function.

If the melting takes place due to rain, then the runoff will be a mixture of the rain and snowmelt that has re-equilibrated with the remaining snowpack. The d18O value of the runoff will depend on the amount of rain, and the amount of melting, but will initially be less than –16.8‰ (d18Orain + e18Ow-i = –14 – 2.8 = –16.8‰) and will evolve towards the isotopic composition of the rain. This diagram assumes equal contributions from the rain and snowmelt at the outset, evolves toward 100% rain.


5. The following precipitation and groundwater data (Excel 3.0 or Excel 5.0) were collected from a heavily irrigated agricultural region. A buildup of salinity has been noted over the past decade which threatens the viability of certain crops. What is the average water loss experienced by these groundwaters? Can irrigation practices be improved to reduce evaporative losses?
 
Precipitation
Groundwater
d18
d2
Cl
d18
d2
Cl
-1.6
-9
6
-4.2
-31
78
-3.8
-27
10
-4.5
-32
150
-4.2
-25
9
-4.2
-29
171
-5.6
-42
14
-4.9
-37
227
-2.6
-19
12
-5.2
-39
65
-3.8
-25
12
-4.5
-33
201
-1.9
-14
4
-3.9
-28
141
-1.7
-12
15
-4.8
-35
114
-5.3
-39
3
-4.1
-31
50
-3.4
-26
8
-4.1
-33
196
-4.7
-37
6
-5.4
-31
9
-6.6
-43
9
-7.6
-56
14
-1.1
-3.8
12
-3.5
-25
9
-2.7
-14
15
-8.9
-63
3
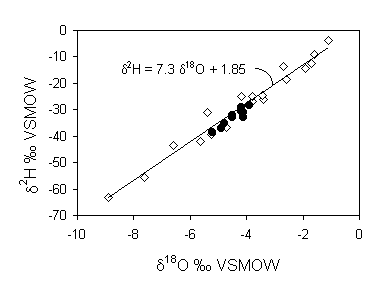
  A plot of d18O vs. d2H shows immediately that the salinity buildup is not related to evaporation, as there is no evaporation trend in the isotope data.

The increase in salinity is due to transpiration by crops. This is a non-fractionating process and so does not affect the isotopic composition of the groundwater. Improving irrigation methods will not cut down on water loss. The average water loss is reflected by the increase in salinity. The average Cl content in the precipitation is 9.4 mg/L, whereas in the groundwater it is 134 mg/L. This is a 14.2 fold increase in salinity and so the residual water fraction f = 1/14.2 = 0.07. This means that 93% of the water has been lost to transpiration.