Chapter 2:
Tracing The Hydrological Cycle
While undertaking a regional survey of nitrate in shallow alluvial groundwater in the Fraser Valley near Vancouver, B.C., the project hydrogeologist queried one homesteader about the quality of his well water. "Why, it’s crystal clear . . . it’s recharged by the glaciers up there on Mount Baker." Following his gaze to Baker, some 60 km south on the far side of the Fraser River, the hydrogeologist speculated on the improbability of the fellow’s claim. In such a case, environmental isotopes serve nicely to trace the origin of the groundwaters and reconcile the two opinions.
Stable isotopes in water,
18O and 2H, are affected by meteorological processes that provide a characteristic fingerprint of their origin. This fingerprint is fundamental to investigating the provenance of groundwater.
Craig’s Meteoric Relationship in Global Fresh Waters
The flux of moisture from the oceans and its return via rainout and runoff is, on an annual basis and global scale, close to a dynamic equilibrium. Only major climatic shifts will seriously change the storage of fresh water in glacial, groundwater and surface water reservoirs. Within the existing cycle, however, significant variability does exist and, as only about 10% of the moisture evaporating from the oceans reaches the land surface, one might expect considerable variation in the terrestrial portion of the hydrological cycle. Evaporation from the oceans, rainout, re-evaporation, snow and ice accumulation and melting, and runoff vary under different climatic regimes. Each step of this cycle partitions 18O and 2H amongst the different freshwater reservoirs.
Considering the complexity of the hydrological cycle, it may be surprising that 18O and 2H behave at all predictably. In 1961, Harmon Craig published his finding that d18O and d2H in fresh waters correlate on a global scale. Craig’s "global meteoric water line" defines the relationship between 18O and 2H in worldwide fresh surface waters:
d
2H = 8 d18O + 10 ‰ SMOW (Craig, 1961b)Note that the term "meteoric" is used in isotope hydrology rather than "meteorological", probably for ease of pronunciation, and has nothing to do with fiery objects from space. Also note the use of SMOW as a reference. VSMOW was not introduced until over a decade later. Subsequent monitoring of the stable isotopic composition of precipitation world wide (IAEA Global Network for Isotopes in Precipitation – GNIP) has refined this relationship, shown in Fig. 2-1. The importance of Craig’s observation is that the isotopic composition of meteoric waters behaves in a predictable fashion.
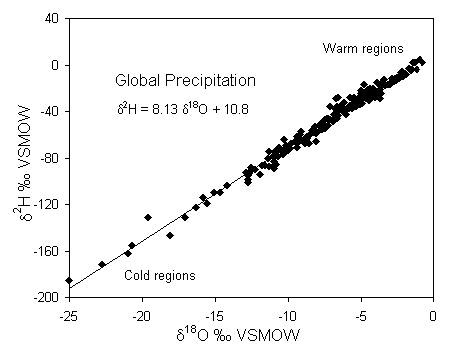
Fig. 2-1 The meteoric relationship for 18O and 2H in precipitation. Data are weighted average annual values for precipitation monitored at stations in the IAEA global network, compiled in Rozanski et al. (1992).
Craig's line is only global in application, and is actually an average of many local or regional meteoric water lines which differ from the global line due to varying climatic and geographic parameters. Local lines will differ from the global line in both slope and deuterium intercept. Nonetheless, Craig's paper is perhaps the most often cited in environmental isotope hydrology as his global meteoric water line (GMWL) provides a reference for interpreting the provenance of groundwaters. A key observation made by Craig was that isotopically depleted waters are associated with cold regions and enriched waters are found in warm regions. This partitioning was soon recognized as a tool for characterizing groundwater recharge environments, and is now the basis of groundwater provenance studies.
Humidity and kinetic (nonequilibrium) evaporation
The rate of evaporation limits vapour-water exchange and so limits the degree of isotopic equilibrium. Increased rates of evaporation impart a kinetic or nonequilibrium isotope effect on the vapour. Kinetic effects are affected by the surface temperature, wind speed (shear at the water surface), salinity, and most importantly, humidity. At lower humidities, water-vapour exchange is minimized, and evaporation becomes an increasingly nonequilibrium process.
Isotope effects during nonequilibrium evaporation from surface water bodies has been examined theoretically and experimentally (e.g. Craig and Gordon, 1965; Gonfiantini, 1965; Merlivat, 1970; Gat, 1971). Gonfiantini (1986) provides an excellent summary of this work. The principal observation is that water becomes progressively enriched in both 18O and 2H during evaporation (Fig. 2-2). However, the humidity, h, affects this progressive enrichment. If there is no exchange with the vapour phase (h remains close to 0%), the enrichment follows a Rayleigh distillation. This is an exponential function that describes the progressive partitioning of (in this case) heavy isotopes into the water reservoir as it diminishes in size:
R = Ro f (a–1)
Ro is the initial isotope ratio in the water, R is the ratio when only a fraction, f, remains, and a is the equilibrium fractionation factor during evaporation. Rayleigh processes are important in other hydrogeological processes and are discussed in greater detail later in this chapter.
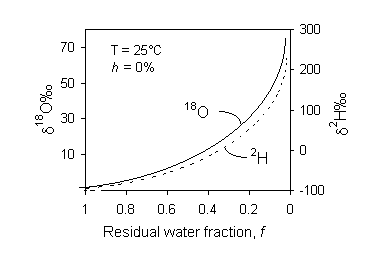
Fig. 2-2 Enrichment of 18O and 2H in distilled water during evaporation of water under controlled conditions. Humidity h is 0% and temperature is 25°C. As the fraction of water remaining approaches 0, a Rayleigh distillation causes an exponential increase in the heavy isotopes. Under conditions of increasing humidity, exchange with the vapour phase reduces the exponential enrichment. Under conditions of high humidity, a steady state value is reached due to complete exchange with the vapour mass.
The model for water-vapour transfer involves a series of steps through the water surface and boundary layer into the open atmosphere (Fig. 2-3). The boundary layer is a microns-thick atmosphere over the liquid water interface with virtually 100% water saturation. This layer is in isotopic equilibrium with the underlying water column.
Between the boundary layer and the mixed atmosphere above is a transition zone through which water vapour is transported in both directions by molecular diffusion. It is within this layer that nonequilibrium enrichment arises. Molecular diffusion is a fractionating process due to the fact that the diffusivity of 1H216O in air is greater than 2H1H16O or H218O.
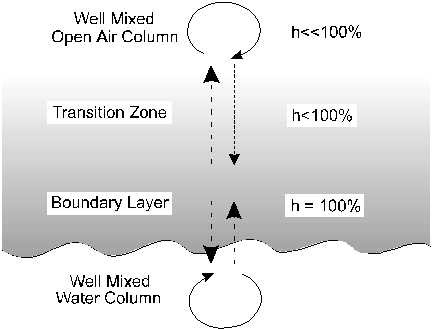
Fig. 2-3 Model for nonequilibrium evaporation over a water body. Arrows indicate relative fluxes of water between the mixed water column and the boundary layer, and between the boundary layer and the well mixed air column. Differences in the rate of diffusion of 18O to 16O and 2H to 1H impart a "kinetic" isotope depletion in the overlying air column.
Under conditions of high humidity (h near 1), diffusion in both directions through the transition zone is equal and no net diffusive fractionation occurs. However, when h is low, net diffusion from the boundary layer to the atmosphere will occur. This depletes the boundary layer (and water surface) in the more diffusive 1H216O species and enriches these reservoirs in the heavy isotopes, 2H1H16O and H218O. The maximum kinetic enrichment that this diffusive effect can impart is calculated from our formula for diffusive fractionation of a gas in air (Chapter 1). In this case it is calculated for 18O in H2Ov from the boundary layer (bl) to the vapour reservoir of the open air water vapour (v):

Using the molecular mass of H218O (20), H216O (18), and air (mair = 28.8 for 79% N2 and 21% O2), gives De18Obl-v = 1.0323. Converting this to permil enrichment, we see that for 18O, the water vapour would be depleted from the water column by a kinetic factor (De) as large as:
De
18Obl-v = (a18Obl-v – 1) · 103 = 32.3‰Similarly, 2H in the water vapour would be depleted by a maximum of:
De
2Hbl-v = (a2Hbl-v – 1) · 103 = 16.6‰In reality, these kinetic effects are not so extreme because humidity is seldom close to 0%. Gonfiantini (1986) describes the kinetic effect in terms of humidity with the following relationships:
De
18Obl-v = 14.2 (1–h) ‰De
2Hbl-v = 12.5 (1–h) ‰The total fractionation between the water column and the open air is then the sum of the fractionation factor for equilibrium water-vapour exchange (el-v) and the kinetic factor (Debl-v). For 18O, this would be:
d
18Ol – d18Ov = e18Ol-v + De18Obl-vRemember to keep the subscripts in the right order. These calculations are presented as the enrichment of the water with respect to the vapour. The depletion in the vapour with respect to the water is the reciprocal or negative enrichment.
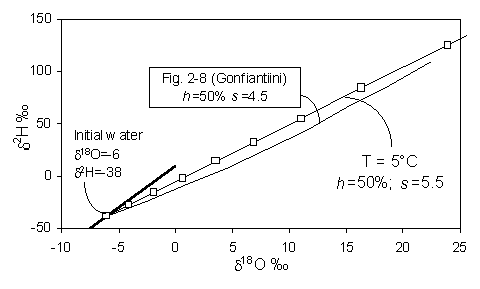
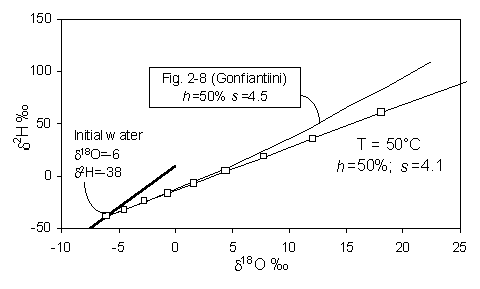
On a d18O - d2H diagram, the result is a deviation from the meteoric water line along a line with a lower slope, s, which depends largely on the relative humidity, h. Gonfiantini presents the mathematical basis for this relationship, shown in Fig. 2-4. At values of low h, kinetic evaporation is maximized and s will be low. Gat (1971) calculates that for very low relative humidities (in the order of 0.25), s will be close to 4, whereas for h closer to 0.75, s is greater than 5. Not until h reaches 0.9 does the slope approach 8.
During evaporative enrichment of water, the vapour will have a reciprocal depletion, and plot on the same evaporative line, but opposite the initial composition of the water (i.e. on the left side of the meteoric water line).
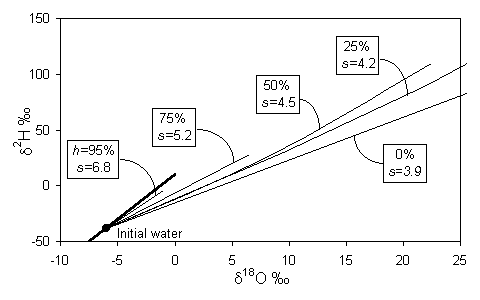
Fig. 2-4 Isotopic enrichment in evaporating water and the effect of humidity. Slopes are approximations of early portion of each curve near the GMWL (heavy line) (modified from Gonfiantini, 1986).
This discussion of nonequilibrium isotope effects caused by evaporation gives us a basis for studying isotope partitioning in the hydrological cycle. Later in this chapter, the effects of extreme evaporation will be explored, in the context of water balance in lakes, and the concentration of solutes in brines.
Condensation, Precipitation and the Meteoric Water Line
The preceding section shows that the formation of atmospheric vapour masses is a nonequilibrium process due to the effects of low humidity and mixing of different vapour masses. However, the reverse process — condensation to form clouds and precipitation — takes place in an intimate mixture of vapour and water droplets with 100% humidity. Here, equilibrium fractionation between vapour and water dominates (see Table 1-4), although some in-cloud processes play a role in determining the d18O and d2H composition of precipitation. The isotopic evolution of precipitation during rainout is largely controlled by temperature.
Early studies on the isotopic composition of precipitation were made by Dansgaard (1953), Epstein and Mayeda (1953) and Friedman (1953). Later, the International Atomic Energy Agency (IAEA), in collaboration with the World Meteorological Organization (WMO), established the Global Network of Isotopes in Precipitation (GNIP) — a world-wide selection of meteorological stations at which samples are collected to monitor the d18O-d2H composition of precipitation.
The data produced by this network are essential for environmental isotope hydrology. They are available on the world wide web at <www.iaea.or.at:80/programs/ri/gnip/gnipmain.htm. The regression line for the long-term averages of d18O and d2H measured for precipitation at the 219 stations in the network adds some precision to Craig's line:
d
2H = 8.17 (± 0.07) d18O + 11.27 (± 0.65) ‰ VSMOW (Rozanski et al., 1992)This line is the true global meteoric water line, as it is based on precipitation and not on surface waters. The global meteoric water line is essentially an average of local or regional meteoric water lines which vary in both slope and intercept according to meteorological conditions. A major result of the IAEA-WMO survey is a rather comprehensive picture of the global distribution of stable isotope contents in precipitation. The global distribution of 18O derived from these data is presented in Chapter 3.
Rainout and Rayleigh distillation
The only way to produce rain is through the cooling of a vapour mass. If the temperature doesn’t drop, it will not rain. Cooling occurs by adiabatic expansion (no loss of enthalpy) as warm air rises to lower pressures, or by radiative heat loss. When the dew point is passed (the temperature at which humidity is 100%), water vapour condenses to maintain thermodynamic equilibrium, and it will rain (or snow). If the temperature stabilizes or warms, condensation stops and humidity drops.
As an air mass follows a trajectory from its vapour source area to higher latitudes and over continents, it cools and loses its water vapour along the way as precipitation, a process known as "rainout." Within the cloud, equilibrium fractionation between vapour and the condensing phases preferentially partitions 18O and 2H into the rain or snow (recall in Fig. 1-6). Along the trajectory of the air mass, the process of rainout distills the heavy isotopes from the vapour. The vapour then becomes progressively depleted in 18O and 2H according to a Rayleigh–type distillation. Isotopically enriched rain is forming and falling from a diminishing vapour mass, and the residual vapour becomes isotopically depleted. Subsequent rains, while enriched with respect to the remaining vapour, will be depleted with respect to earlier rains from the same vapour mass. Rainout is then an evolution towards colder, isotopically–depleted precipitation.
This strong correlation between temperature and d18O–d2H controls the position of precipitation on the meteoric water line. From this correlation we can derive isotope effects due to seasons, altitude, latitude, continentality and paleoclimates — the basis of isotope hydrology.
We can model this temperature — isotope evolution during rainout according to the same Rayleigh distillation equation presented for evaporation (page 41):
R = Ro f (a–1)
In this case, Ro is the vapour’s initial isotope ratio (18O/16O or 2H/1H) and R would be the ratio after a given proportion of the vapour had reacted (i.e. rained out). The fraction f is the residual vapour reservoir in the cloud. The fractionation. factor a is for equilibrium water-vapour exchange at the prevailing in-cloud temperature (Table 1-4). Equilibrium fractionation during condensation is generally the case in clouds, where h = 100%. Only in the super-cooled air masses at high latitudes will kinetic effects become important (Fisher, 1991). In a Rayleigh function, a is expressed as product-reactant (i.e. al-v). In the case of 18O, this would be a18Ol-v = 1.0094 at 25°C, but will increase as the temperature drops. Rayleigh processes in other isotope systems are presented in more detail at the end of this chapter. Here we will use a simplified version of the Rayleigh equation to calculate d18O evolution during rainout (Fig. 2-13).
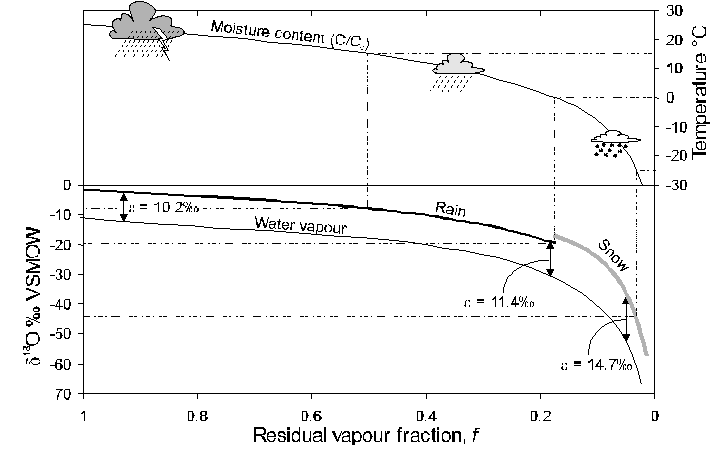
Fig. 2-13 The change in the 18O content of rainfall according to a Rayleigh distillation, starting with d18Ovapour = -11‰, temperature = 25°C, and a final temperature of –30°C. Note that at 0°C, fractionation between snow and water vapour replaces rain-vapour fractionation. The fraction remaining has been calculated from the decrease in moisture carrying capacity of air at lower temperatures, starting at 25°C (from calculations for Fig. 2-4). Dashed lines link d18O of precipitation with temperature of condensation.
A Closer Look at Rayleigh Distillation
Rayleigh-type evolution occurs for a host of isotope reactions. The example of a depleting water vapour mass during rainout is only one. Another is the change in d18O and d2H during the freezing or evaporation of water. The d34S of sulphate is enriched by a Rayleigh process during the reduction of SO42– to H2S in aquifers. The evolution of d13CDIC during methanogenesis by CO2 reduction, or d15N during denitrification are other examples. In all cases, an exponential enrichment or depletion occurs in the residual reservoir of the reactant as it is converted to the product. For an ideal distillation, the reactant reservoir must be finite and well mixed, and does not re-react with the reaction product.
The general form of a Rayleigh distillation equation states that the isotope ratio (R) in a diminishing reservoir of the reactant is a function of its initial isotopic ratio (Ro), the remaining fraction of that reservoir (f) and the equilibrium fractionation factor for the reaction (aproduct-reactant):
R = Ro f (a–1)
For the example of 18O in evaporating water, this would be:

This form of the Rayleigh equation is more easily used when expressed in d–‰ notation. Converting the isotope ratios to d values gives:
![]()
![]()
When the d-values are small (i.e. close to the reference VSMOW), this equation can be simplified to:
d – do @ 103 (a – 1) · ln f
or d – do @ e · ln f
Using a generic isotope with an arbitrary initial value (do-react) and fractionation factor (eprod-react), a Rayleigh distillation can be plotted (Fig. 2-21).
The evolution observed in the reactant reservoir during a Rayleigh distillation will also be seen in the product reservoir (Fig. 2-21). However, we can consider this evolution in the reaction product as either an instantaneous product (open system) or as an accumulating product reservoir (closed system). In an open system, the product is instantaneously removed from the system and does not mix with subsequent reaction products (e.g. ice from the freezing of water). In a closed system, the product forms a growing and well-mixed reservoir (e.g. H2S accumulating in a groundwater during sulphate reduction).
The isotopic composition of the product reservoir under closed system conditions is derived from the isotopic composition of the entire system, which is equal to the initial value of the reactant reservoir, ![]() .At any point during the reaction, the isotopic composition of the two reservoirs obeys the mass-balance equation:
.At any point during the reaction, the isotopic composition of the two reservoirs obeys the mass-balance equation:
do–react = f · dreact + (1 – f) · dprod–reservoir
Recalling that:
d
react = do–react + e · ln fthe mean isotopic composition of the product reservoir (dprod-reservoir) can be determined:

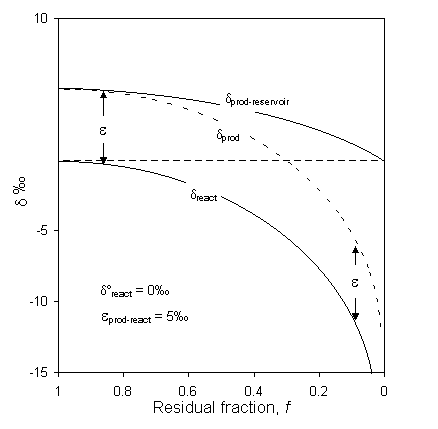
Fig. 2-21 Rayleigh distillation of a reactant reservoir as it reacts to completion under (a) open system conditions represented by the dprod curve (i.e. the product is removed from reacting or mixing), and (b) under closed system conditions where the product reservoir is well mixed, represented by the dprod-reservoir curve.
Note that as f ®1, dprod-reservoir ®dreact + e, but be careful as the equation is undefined for f = 1. The isotopic evolution of the product reservoir (Fig. 2-21) eventually equals the original isotopic composition of the reactant, thus preserving the isotopic mass balance of the system.
The freezing of water is a good example of a closed system reaction. As a given reservoir of water begins to freeze, the first ice to form will be enriched in 18O by about 3‰ (see Table 1-4) and the water will be marginally depleted. As freezing continues, the ice formed from the continually depleted water preserves this trend towards increasingly lower d-values.
Michel (1986) shows nice Rayleigh distillation curves for ice in a frost blister formed under closed system conditions. The frost blister formed by continuous downward freezing in a water-filled cavity overlying permafrost. Samples from a vertical profile through a metre of ground ice (Fig. 2-22) show a systematic trend towards depleted values, reflecting the evolution of the water from which the ice was forming. Data displaying a Rayleigh distillation can then be used to calculate the fractionation factor for the reaction, which in turn can be diagnostic of the process. In the case of Fig. 2-21, the calculated a values are slightly lower than for equilibrium fractionation, indicating minor kinetic (diffusion) effects during freezing. From a data set such as this, the d18O of the water precursor can then be determined from the calculated fractionation factor and the d18O value of the initial ice (d18Ow = do18Oi – e18Oi–w), or from the amount-weighted mean of all the samples (![]() ).
).
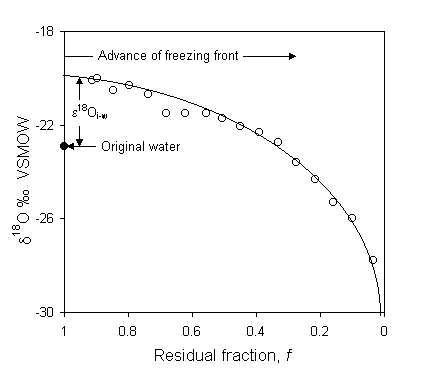
Fig. 2-22 Rayleigh distillation of 18O during freezing of water in the fixed volume reservoir of an ice blister in a permafrost landscape in the Yukon Territory, Canada (data from Michel, 1986).
1. Is it possible to distinguish on the basis of 18O and 2H analyses the original isotopic composition of surface water which has undergone evaporation? Explain.
If sequential samples are taken from the (well mixed) water during evaporation, their d18O and d2H composition will produce a line with slope less than 8, originating at the initial isotopic composition of the water before evaporation. Back extrapolation along this line to the origin on the local meteoric water line will yield the initial isotopic composition.
2. What controls the 18O and 2H content in precipitation — kinetic or equilibrium fractionation?
The isotopic composition of precipitation is controlled in most cases by equilibrium fractionation during condensation. However, the isotopic composition of the water vapour is controlled by a combination of kinetic fractionation during primary evaporation (humidity less than 100%) and mixing of vapour masses in the atmosphere.
The fractionation between vapour and precipitation is greater at lower temperatures. Why then is precipitation at lower temperatures more depleted than at warmer temperatures?
Recall the Rayleigh depletion for 18O and 2H in a vapour mass during rainout. Rainout is driven by decreasing temperature, and the heavy isotopes are continually partitioned into the rain (and snow). The progressive depletion in the vapour is seen in precipitation in lower temperature regions.
3. The fractionation between vapour and precipitation is greater at lower temperatures. Why then is precipitation at lower temperatures more depleted than at warmer temperatures?
Recall the Rayleigh depletion for 18O and 2H in a vapour mass during rainout. Rainout is driven by decreasing temperature, and the heavy isotopes are continually partitioned into the rain (and snow). The progressive depletion in the vapour is seen in precipitation in lower temperature regions.
4. What is the variation in the d18O value for ocean water between the glacial maximum (ca. 21,500 years ago) and today? Why the change?
The isotopic composition of the ocean changed by 1.5 to 2‰. At the glacial maximum, the large reservoir of global glacier ice stored isotopically depleted precipitation (–25 to –35‰ VSMOW), causing a reciprocal enrichment in ocean water. Melting of the ice sheets during the Holocene returned this depleted water to the oceans.
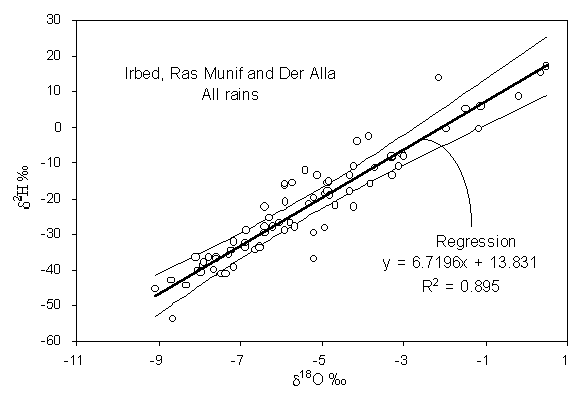
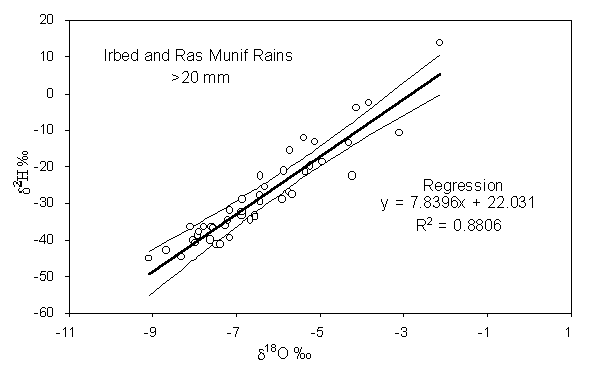
5. The data set Jordan precipitation comprises rainfall data for three meteorological stations at different altitudes from the summit of the Ajloun Mountain (Ras Munif) to the Dead Sea in the Jordan rift valley (Der Alla) (Bajjali et al., 1997). From these data establish a local meteoric water line for northern Jordan. The confidence limits for this meteoric water line are calculated on the spreadsheet using standard statistical methods, and can be used as a template for other precipitation data.
